
According to the latest data from the U.S. Census Bureau, the median annual property tax paid by homeowners was $2,578 in 2019, or 1.03 percent of home value - not a huge percentage on average, but many households pay far more than this based on local tax rates and home values in a given market. Further, beginning in 2018, the Trump administration’s SALT tax cap kicked in, limiting the amount of state and local taxes homeowners could deduct from their federal income taxes. Consequently, living in a high-tax state has become increasingly more expensive.
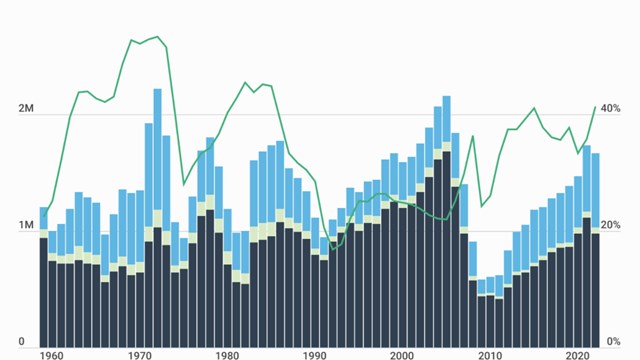
Data from the US Census Bureau shows that in aggregate, property taxes are state and local governments’ biggest source of tax revenue. Nationally, state and local property taxes totaled $617 billion in 2019, or 39 percent of total state and local government tax revenue. Property tax revenue amounted to $159 billion more than income taxes, which represent the next largest state and local government tax revenue source.
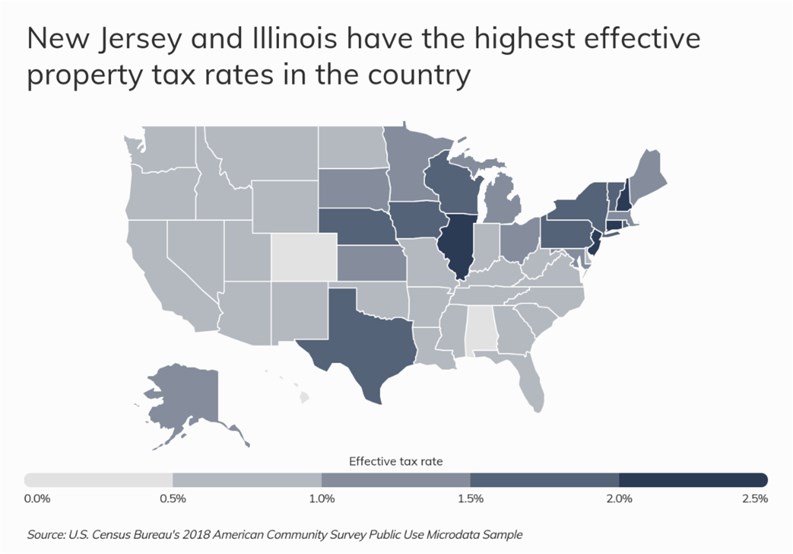
Naturally, property tax rates vary widely by location - rendering some parts of the U.S. far more expensive to live in than others. While property taxes are levied in different ways based on local and state laws, a helpful way to compare tax burdens across locations is to calculate an effective property tax rate by dividing the total property taxes paid by the aggregate value of homes in a given area.
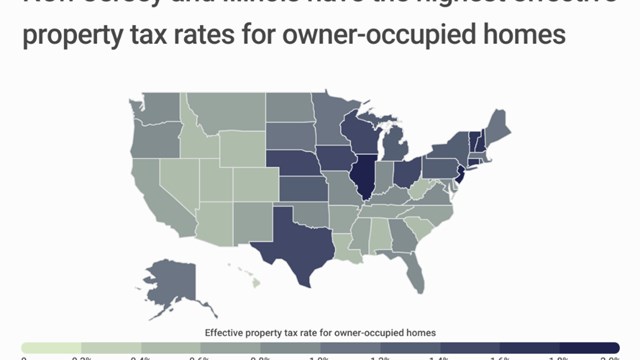
At the state level, Americans living in New Jersey and Illinois tend to pay the most in property taxes relative to home values. These states have the highest effective property tax rates, at 2.42 and 2.16 percent respectively. On the other hand, people living in Hawaii and Alabama have much lower property tax bills, with effective property tax rates of 0.40 and 0.28 percent. While the total amount of property tax paid is a function of both tax rates and home values, residents in states with high effective property tax rates also tend to pay the most in absolute terms. For example, the typical New Jersey homeowner paid an astonishing $8,432 in property taxes last year - the highest bill in the country.
To determine the cities with the highest and lowest property taxes, researchers at Oakland, California-based financial tech startup Roofstock analyzed the latest housing data from the U.S. Census Bureau. Cities were ranked according to their effective property tax rate, measured as aggregate real estate taxes paid divided by the aggregate value of homes. Researchers also calculated median property taxes paid, median home value, and median household income for owner-occupied homes.
To improve relevance, only cities with at least 100,000 people were included in the analysis. Additionally, cities were grouped into cohorts based on population size. In the report, small cities have 100,000–149,999 residents, midsize cities have 150,000–349,999 residents, and large cities have at least 350,000 residents.
For comparison, here are the statistics for the entire United States:
- Effective property tax rate: 1.03%
- Median property taxes paid: $2,578
- Median home value: $240,500
- Median household income (owner-occupied homes): $81,988
For more information, a detailed methodology, and complete results, you can find the original report on Roofstock’s website: https://learn.roofstock.com/blog/cities-with-highest-property-taxes


Leave a Comment